lldb is not a Python debugger. That requires specialized knowledge of the Python runtime which lldb doesn’t have.
If you want to debug your Python code, you can use the Python pdb module. lldb will interoperate with PDB, so you can put a pdb breakpoint() call in your python code, or use it to set breakpoints, and even though you’re running the program under lldb as well, lldb won’t interfere with the Python debugger. That allows you to use pdb to debug your Python code and lldb to debug any underlying C/C++/Swift modules.
I have seen projects in the past that have used a C-language debugger and knowledge of the Python method dispatch machinery on the C side to “turn C stacks into Python stacks” or to “wait for a particular Python method dispatch or function call”. But I don’t know of a current one of these for lldb. That’s a lot more labor intensive than just using the built-in python debugger, however.
Jim
On May 14, 2023, at 6:35 AM, Govind via LLVM Discussion Forums notifications@llvm.discoursemail.com wrote:
Hi, I am new to LLDB and exploring using LLDB to debug running programs. I am trying to attach LLDB to a running python server on my local machine via attach --pid. I am trying to attach a breakpoint on a Python function in my code
e.g: def getlockandshow(Request) so that I can inspect the behaviour of this function during a function run.
However when attempting to set a breakpoint on this function via a func-regex , the debugger is unable to resolve this function name to any location
(lldb) breakpoint set --func-regex="getlockandshow"
Breakpoint 1: no locations (pending).
WARNING:  Unable to resolve breakpoint to any actual locations.
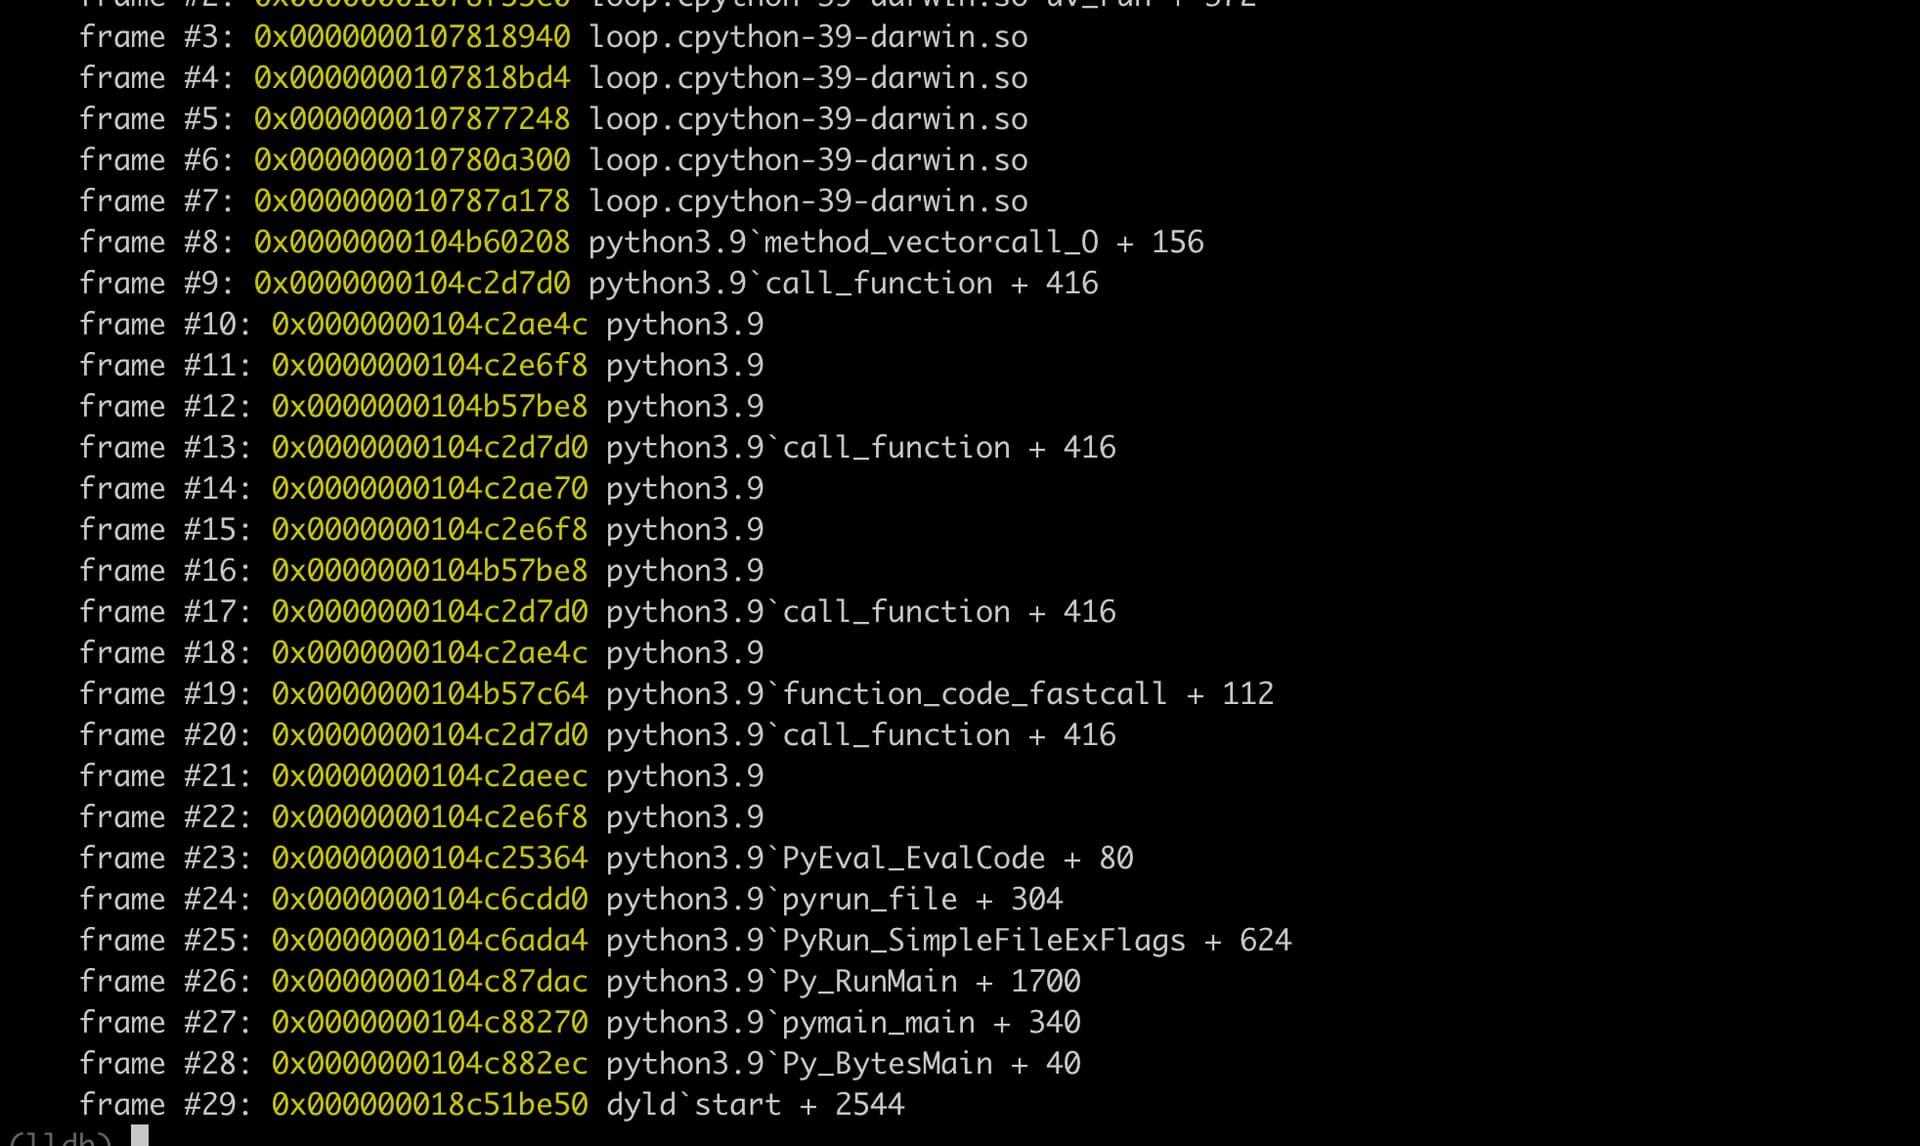
I am looking at the backtrace of the running threads to see if I can spot any function name from my code, but all I see are the fn names from the core python interpreter
is there a way to set a breakpoint in my Python code on fns written by me ?
Visit Topic or reply to this email to respond.
To unsubscribe from these emails, click here.