[RFC] Much faster cross translation unit (CTU) analysis implementation

The Clang analyzer is capable of CTU analysis by importing definitions of
functions from other translation units. CodeChecker users have been using CTU
since 2018, and we repeatedly receive these major critiques:

  1. CTU analysis is slow. Indeed, the slowdown is usually around 2x-5x in case
    of C projects (compared to the single TU analysis). The slowdown can be up-to
    10x-12x in case of a more complex C++ project (e.g. protobuf).
  2. CTU is loosing bug reports, compared to the single translation unit
    analysis. Because of the loss of results, users most often run BOTH the single
    TU and the CTU analysis.
    To address these issues, we have been working on an alternative CTU
    implementation, which we are planning to upstream soon.

The new implementation is the natural extension of the normal single TU
analysis. The approach consists of two analysis phases. During the first phase,
we do a normal single TU analysis. During this phase, if we find a foreign
function (that could be inlined from another TU) then we don’t inline that
immediately, we rather mark that to be analysed later.
When the first phase is finished then we start the second phase, the CTU phase.
In this phase, we continue the analysis from those points (exploded nodes)
which had been enqueued during the first phase. We gradually extend the
exploded graph of the single TU analysis with new nodes that are created by the
inlining of foreign functions.

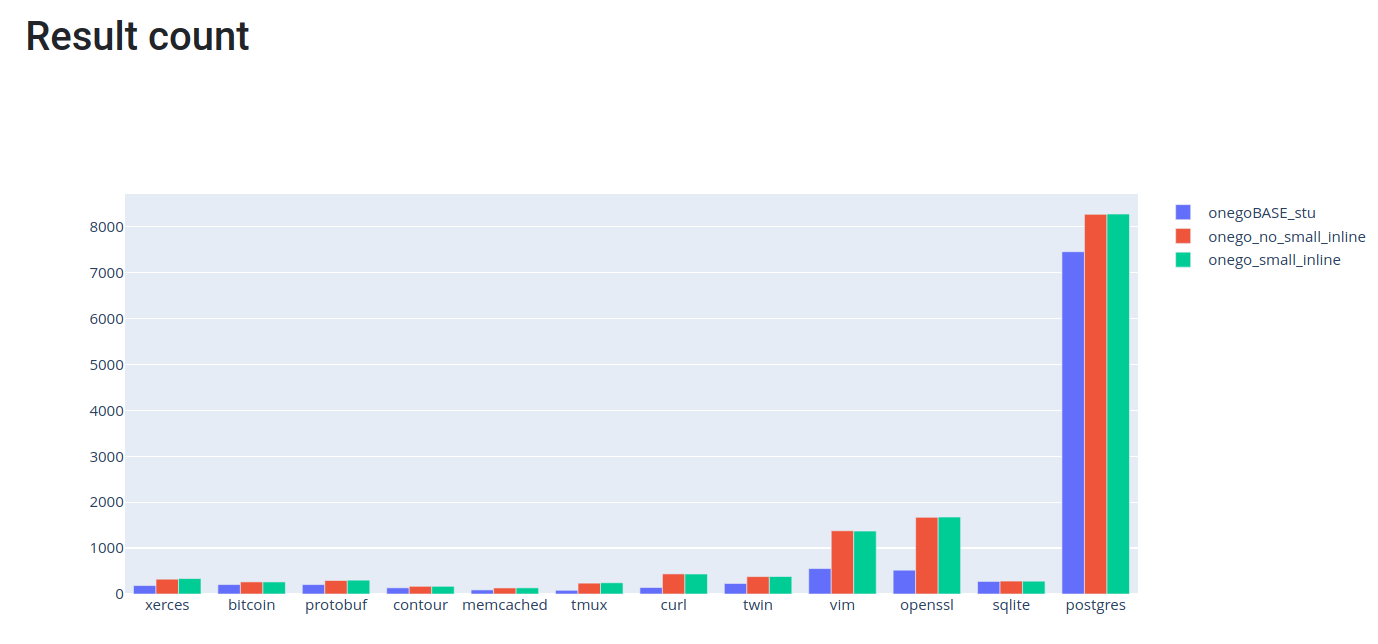
We count the number of analysis steps of the first phase and we limit the
second (ctu) phase with this number. Measurements show that we can keep the
slow-down most of the time around 2x even in case of complex C++ projects. We
may loose not more than 2% of the bug reports, compared to single TU analysis.
These lost reports stem from the fact that the AST is extended from foreign TUs
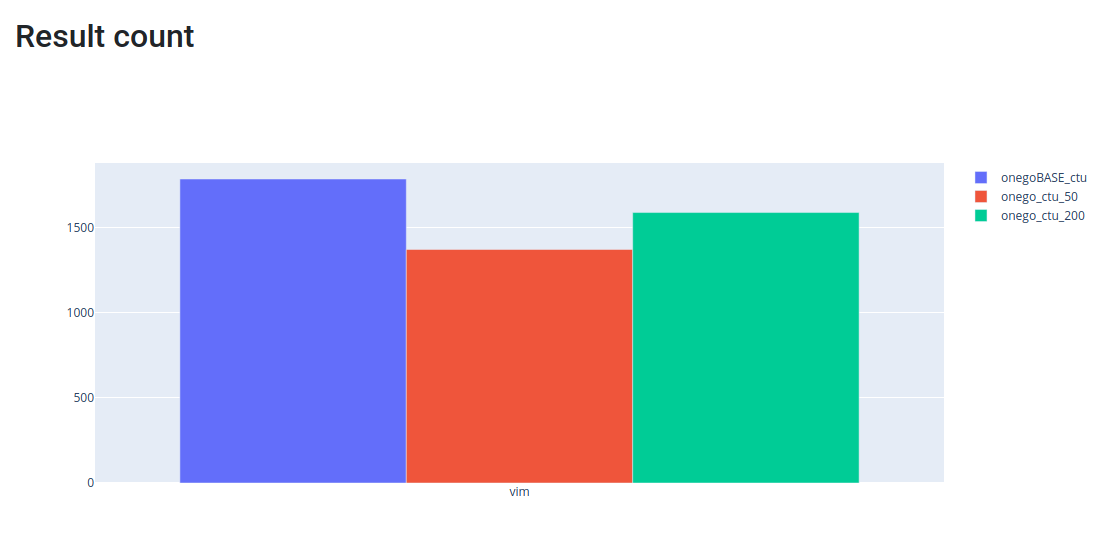
and these lost reports are false positives. Compared to the original CTU,
however, we may loose roughly 25% of the bug reports; this is the trade-off
that we take to constrain the runtime down to 2x.

1 Like

@NoQ @Xazax-hun @steakhal @Szelethus @gamesh411 @dkrupp @ASDenysPetrov

Patch set is available. The main patch is this:
https://reviews.llvm.org/D123773

The new implementation is the natural extension of the normal single TU
analysis

It seems like you propose changing the current behavior of the ctu mode. How do you plan upstreaming this? Introducing the new implementation and switching the default ctu mode to this and removing the current implementation?

When the first phase is finished then we start the second phase, the CTU phase.
In this phase, we continue the analysis from those points (exploded nodes)
which had been enqueued during the first phase. We gradually extend the
exploded graph of the single TU analysis with new nodes that are created by the
inlining of foreign functions.

To get this straight, this means that all the false-positive reports produced by the normal path-exploration will remain. And this is the expected/wanted behavior by the users, given that they want to extend the report set by some ctu reports if there is still time.

And another important factor is the scalability, compared across normal and ctu runs. As you mentioned, previously in general ctu runtime was hardly predictable. Now it becomes well predictable, letting the users decide in advance how much time they want to allocate for the ctu extension - compared to a normal analysis time.

When the first phase is finished then we start the second phase, the CTU phase.
In this phase, we continue the analysis from those points (exploded nodes)
which had been enqueued during the first phase.

So you want to have two distinct worklists, one for the first analysis and a second one for the cut extension. How would the implementation behave if we change the worklist implementation? We could already set this in the command line with the exploration_strategy={dfs,bfs,unexplored_first,unexplored_first_queue,unexplored_first_location_queue,bfs_block_dfs_contents} (unexplored_first_queue is the default).
Would it make sense to have a different exploration strategy for the second (ctu) extension phase?

We may lose not more than 2% of the bug reports, compared to single TU analysis.
These lost reports stem from the fact that the AST is extended from foreign TUs
and these lost reports are false positives.

Could you please elaborate on what cases may cause this? Maybe a concrete example would shed some light on this.

Compared to the original CTU,
however, we may lose roughly 25% of the bug reports; this is the trade-off
that we take to constrain the runtime down to 2x.

You made a comprehensive analysis of different scaling factors to find the sweet-spot for having meaningful ctu analysis while having reasonable runtime. You mentioned that this is more-of-less the 2x the runtime of the normal analysis. So, in total it would take 3x (1x normal + 2x ctu) runtime? Am I correct?
Please share the analysis/measurement data of this in an appendix.

I can see one major area to improve, which is the failover.
While the single TU analysis is mature and stable, this is not the case with CTU.
By each day we could have new AST constructs which the ASTimporter doesn’t handle, which frequently materializes in crashes. Even though we try to fix these, they will inherently remain. The new proposed ctu mode will be no worse than the current ctu mode, but if we promote this mode to the users that they can use this instead of the normal mode, they might suffer from losing analysis results at the end of the day due to crashes. Do you think if we can improve the error handling in such cases to the point where the ctu extension won’t mess up the normal reports even if an import error happens?

How large the change would be to implement this proposal?
How many patches do you foresee?

Thanks for your comments and questions Balázs!

Yes. Once the patch stack is merged then this would be the only way to do CTU analysis. So, the normal immediate inlining of foreign functions would not be available.

Exactly. Thanks for the explanatory comments on this.

Well, yes that might make sense for developers who want to experiment. However, the current patch stack supports only one strategy which we evaluated and found to be the best. Actually, I haven’t seen any user to set other than the default exploration strategy even in single TU mode.

Sure. One cause could be the import of VarDecls. Let’s say you have a const variable that is initialized to non-zero in the foreign TU. This knowledge makes those paths infeasible where we assume that the variable would be zero.
Another example is when we analyze a foreign function and the function reaches the maximum block count. Then during the analysis of a subsequent top-level function in the main TU, we will not inline that function again. This could lead to a report loss as well.

2x is the usual run-time overhead compared to single tu analysis. So, with ctu analysis the runtime consinst of 1x for the first phase and 1x for the second ctu phase.

I am afraid we can’t do much with that. Once we had a crash then we cannot just rollback within that process. However, CodeChecker provides a failure handling option --ctu-reanalyze-on-failure which starts a new single tu analysis in case the ctu analysis crashed.

Not counting the changes in test files, the main patch is smaller than ~150 lines. Counting all 3 patches, including comments and tests, I think it is still less than 1000 lines.

Sure, working on it.

At least three. We might want to further split up the second patch (I just don’t know yet how).
https://reviews.llvm.org/D123685
https://reviews.llvm.org/D123773
https://reviews.llvm.org/D123784

I added this feedback to one of the patches and later realized maybe it is better to discuss design here rather than on Phabricator. I am not sure whether this is the right decision. I think it might depend on the function whether we want to inline it in the first phase or the second one. Specifically, always inlining small functions found to be beneficial in the past. I was wondering if you experimented or plan to experiment with this direction (inline small functions with few cfg nodes eagerly in phase 1, and leave the rest to phase 2).

In which phase do you plan to import the initializers of global/static constants?

On one hand, I see your point, and I agree that it makes sense to have an experiment with imminent inlining of small functions. I’ll do those measurements soon. On the other hand, our users tend to run both the single TU and the CTU analysis because they don’t want to loose any bug-report from the single TU mode. If we were to inline small functions unconditionally then the number of lost single TU reports would increase. Although, we might argue that those reports are very likely false positives. Nevertheless, we want to keep as much as possible single TU reports even if they are likely false positives; this way we can persuade our users to run only the new CTU mode.

This happens before any of the phases, even before the start of the path sensitive analysis. We have a separate AST traversal that discovers the external constants and imports their definition. This is an existing feature since two years, landed in âš™ D46421 [analyzer][CrossTU] Extend CTU to VarDecls with initializer

If this is the case, it is still possible to lose bug reports after we turn CTU on. If there is a false positive in the regular analysis on an infeasible path that we no longer report in CTU after we import the initializers for global constants the users will have the same experience. Losing reports with CTU on.

I think it makes sense to minimize the lost bug reports in CTU, but not sure if we actually want to push this to the extreme. See the case I mentioned previously, importing global constants eagerly can also result in lost reports. Although, most of those are probably false positives anyway. I think losing false positives might provide more value than putting extra efforts into not losing any results.

I think the question is the following: is it better to keep false positives just to make users more comfortable they did not lose any reports? Or should we try to go for a solution instead where users would gradually learn that the large majority of the lost reports were false positives anyway, so they will no longer run the non-CTU version.

I think it might be possible to make some adjustment such that CTU can also eliminate false positives but missing true positives that non-CTU would find would be extremely rare. E.g., we could inline small functions eagerly across TUs, but do not include the exploration of those functions in the analysis budget of the first phase.

Alright, makes sense. I’m adding a config option for this and going to conduct measurements when small foreign functions are inlined in the first phase. I’ll come back with the results.

Here I am attaching the measurement results. Unfortunately the platform does not allow to upload files with .html, thus I uploaded them with an additional .txt extension. After download, please rename these files to have a .html extension and open them in your browser. The html files were generated by the csa-testbench tool that has been specifically designed for conducting measurements with the Clang Static Analyzer.

Differences between the new implementation and the old
onego_vs_base.html.txt (240.3 KB)

  • onegoBASE_stu denotes the baseline - the version that has the original implementation - with single TU analysis mode.
  • ctuonego_stu denotes the new implementation, but with the single TU mode.
  • ctuonego_bestctu denotes the new implementation with CTU mode and with the best configuration (more about the configs later).
  • onegoBASE_ctu denotes the baseline with CTU analysis mode.

In my (biased) opinion, the drop of the runtime during protobuf and xerces analysis is remarkable.
Note: Here, the ctuonego versions do not import the foreign global const variables neither do they inline small functions in the first phase.

Variants and best configuration options of the new implementation
onego_variants.html.txt (313.5 KB)


There are two configuration options that have been varied during this measurement.

  1. ctu-max-nodes-mul that is copied from the patch:
	ANALYZER_OPTION(
    unsigned, CTUMaxNodesMultiplier, "ctu-max-nodes-mul",
    "We count the nodes for a normal single tu analysis. We multiply that "
    "number with this config value then we divide the result by 100 to get "
    "the maximum number of nodes that the analyzer can generate while "
    "exploring a top level function in CTU mode (for each exploded graph)."
    "For example, 100 means that CTU will explore maximum as much nodes that "
    "we explored during the single tu mode, 200 means it will explore twice as "
    "much, 50 means it will explore maximum 50% more.", 100)
  1. ctu-max-nodes-min hat is copied from the patch:
ANALYZER_OPTION(
    unsigned, CTUMaxNodesMin, "ctu-max-nodes-min",
    "The maximum number of nodes in CTU mode is determinded by "
    "'ctu-max-nodes-mul'. However, if the number of nodes in single tu analysis "
    "is too low, it is meaningful to provide a minimum value that serves as an "
    "upper bound instead.", 1000)
  • ctuonegomeas_stu stands for the single TU analysis mode of the new implementation.
  • ctuonegomeas_ctu50 stands for the new implementation with ctu-max-nodes-mul set to 50. And ctu-max-nodes-min is left to the default value that is 1000.
  • ctuonegomeas_ctu50_10kmin: ctu-max-nodes-mul=50, ctu-max-nodes-min=10000.
  • ctuonegomeas_ctu100: ctu-max-nodes-mul=100, ctu-max-nodes-min=1000.
  • ctuonegomeas_ctu100_10kmin: ctu-max-nodes-mul=100, ctu-max-nodes-min=10000.
  • ctuonegomeas_ctu150: ctu-max-nodes-mul=150, ctu-max-nodes-min=1000.

We considered the ctuonegomeas_ctu50_10kmin as the best configuration, thus the ctuonego_bestctu in the previous measurement refers to this setup.

To be continued in the next post (I am worried that discord might not properly handle a post that is too long)

… continuing the presentation of measurement results.

New implementation when VarDecls are imported or when they are not.
novardecl_vs_vardecl.html.txt (173.8 KB)
This measure shows the differences that we might have if we were not to import the foreign global constants. Interestingly, the result count is slightly higher when we do not import these constants. We loose some reports simply because the precision is better. The lost reports are likely false positives, and we can state that with a high confidence.

New implementation when small functions are inlined during the first phase or not.
small_inline.html.txt (227.7 KB)
This measure shows the differences that we have when we inline the small and trivial functions during the first phase.


The overall result count is almost identical in the two cases. However, we have to compare the results to those results that we have in the single TU mode (onegoBASE_stu). I’ve done that by the help of a tiny CodeChecker script diff.py.txt (8.9 KB). We want to see the number of lost reports compared to the single TU run. Below we see the number of lost reports in each project, first for the case when we did not inline the small functions then for the case when we did.

base: onegoBASE_stu compare_to: onego_no_small_inline
0.54%   xerces_v3.2.3: lost 1 from 184
1.94%   bitcoin_v0.20.1: lost 4 from 206
0.98%   protobuf_v3.13.0-CSA-patched: lost 2 from 205
0.00%   contour_v0.2.0.173: lost 0 from 135
0.00%   memcached_1.6.8: lost 0 from 89
0.00%   tmux_2.6: lost 0 from 81
0.00%   curl_curl-7_66_0: lost 0 from 141
0.44%   twin_v0.8.1: lost 1 from 229
0.00%   vim_v8.2.1920: lost 0 from 554
0.19%   openssl_openssl-3.0.0-alpha7: lost 1 from 519
0.00%   sqlite_version-3.33.0: lost 0 from 274
0.00%   postgres_REL_13_0: lost 0 from 7457
1.94%   MAX

base: onegoBASE_stu compare_to: onego_small_inline
2.72%   xerces_v3.2.3: lost 5 from 184
0.97%   bitcoin_v0.20.1: lost 2 from 206
0.98%   protobuf_v3.13.0-CSA-patched: lost 2 from 205
0.00%   contour_v0.2.0.173: lost 0 from 135
1.12%   memcached_1.6.8: lost 1 from 89
0.00%   tmux_2.6: lost 0 from 81
0.71%   curl_curl-7_66_0: lost 1 from 141
0.44%   twin_v0.8.1: lost 1 from 229
1.08%   vim_v8.2.1920: lost 6 from 554
0.58%   openssl_openssl-3.0.0-alpha7: lost 3 from 519
0.00%   sqlite_version-3.33.0: lost 0 from 274
0.05%   postgres_REL_13_0: lost 4 from 7457
2.72%   MAX

And when the reports are uniqued: ctuonego_loss_of_results_UNIQ.txt (5.5 KB). We can see that the loss of results is less than the 2.72% (3.33% in case of uniqueing) of all the results when we inline the small functions. These numbers are 1.94% and 2.55% in case of not inlining those small functions. The higher loss in the small function inline case stems again from the fact that the analysis is more precise, so the lost reports are highly likely to be false positives.

Margin of measurement error
CodeChecker has a known bug that may result in having the very same reports but with different report hashes. See Nondeterministic report-hashes · Issue #3656 · Ericsson/codechecker · GitHub . Below we can review that two identical CodeChecker runs have different reports because of the mentioned discrepancy in the report hashes:

base: ctuonego_stu compare_to: ctu_onegomeas_stu
0       xerces_v3.2.3
1       bitcoin_v0.20.1
0       protobuf_v3.13.0-CSA-patched
0       contour_v0.2.0.173
0       memcached_1.6.8
0       tmux_2.6
0       curl_curl-7_66_0
0       twin_v0.8.1
0       vim_v8.2.1920
6       openssl_openssl-3.0.0-alpha7
0       sqlite_version-3.33.0
0       postgres_REL_13_0

Ideally, the numbers should be 0 in all projects. Consequently, the above mentioned percentages (2.72% and 3.33%) are an overestimate, but a good upper bound.

Thanks!

I looked at the numbers and see somewhat mixed results. E.g., the new implementation is overwhelmingly successful for xerces, it can find almost the same number of errors in half the time! On the other hand, in case of vim the new implementation runs longer than the old one and loses ~28% of the results.

I do agree that that overall it looks like an improvement and support changing the default implementation but some outliers like vim makes me think we might want to keep the old implementation behind a flag. Although admittedly, that would be an extra option to support, so I do not insist. What do you think?

Regarding inlining small functions, in case it does not degrade the runtime, I think losing false positives is always great, so I’d love to see that in the new implementation.

1 Like

Thanks for your review and time Gábor! Besides xerces, I’d like to highlight that protobuf is ctu analysed 5x faster.

Yes, vim seems like an exception, it deserves some more examination. However, the loss of the results is not that dramatic if we increase the ctu-max-nodes-mul config option. E.g. it is “just” 19% if we set that to 150. I am currently running some new measurments for vim and I’ll compare the result set more thoroughly to understand why do we loose that much results (I’ll post an update here soon).

I think that by increasing the ctu-max-nodes-mul config value we are getting closer to the original ctu behavior. Actually, the result count is gradually increasing in all projects when this config value is increased. On the other hand, having an option to unconditionally inline the functions even in the first phase might be useful for some users. So, I’d like to have the new implementation and we could have an option that makes this new implementation behave exactly as the old did. In practice, if we inline all functions during the first phase then the Worklist for the second phase will be empty and that is equivalent to the old behavior.

Yes, I agree, the results are good. I am going to update the patch with that soon.

Here are the results:
vim_loss_of_reports.html.txt (116.1 KB)

  • onegoBASE_ctu denotes the ctu analysis in the baseline.
  • onego_ctu_50 denotes ctu-max-nodes-mul=50, ctu-max-nodes-min=10000 and small functions are inlined as well.
  • onego_ctu_200 denotes ctu-max-nodes-mul=200, ctu-max-nodes-min=10000 and small functions are inlined as well.

Interesting extract of the report is the runtime and the result count.


I could not find anything suspicious or extreme when I compared the concrete results of onegoBASE_ctu and onego_ctu_200. In CodeChecker diff we have the following when the results are uniqued:

So, indeed we do loose 141 reports, but get another 121 reports. In this sense the loss is not significant. Also, seems like the loss simply stems from the difference in the set of inlined functions. Actually, the number of paths explored by the analyzer is way higher in the case of onego_ctu_200, so I think it might happen that with a different set of enabled checkers the onego_ctu_200 would find more results than the old ctu.

Or maybe not … users might not want to tamper with this, I doubt if there is a single user who has the knowledge and confidence for that. So, perhaps we should just provide a good default for them. On the flip side, the config still could be useful for developers, e.g. the ctu-test cases could be more elegant and simplified if we have this option. What do you think?

Actually, it turned out that the bug is in CodeChecker’s hash handling mechanism [fix][clang][server] Add report hash to the report_path_hash by steakhal · Pull Request #3662 · Ericsson/codechecker · GitHub

I just have updated the patch. Your review is more than welcome!