I am analyzing a clang 10.0.0 vs gcc 7.3 performance difference that I can reproduce in the following test.
unsigned foo(unsigned t1, unsigned t2, int count, int step) {
unsigned tmp = 0;
int state = 0;
for (int i = 0 ; i < count ; i += step) {
state++;
if (state > 5)
state = 0;
if (state == 3)
tmp += t2;
}
return tmp;
}
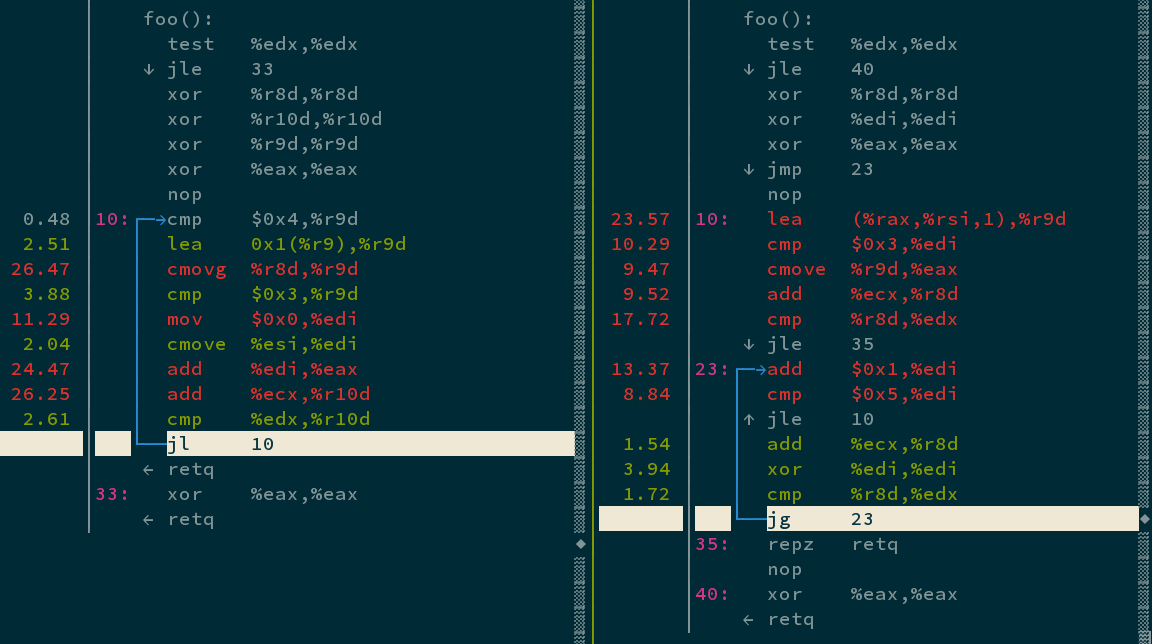
Clang output is about 40% slower when the function is called with t2=7, count=2000000000, step=3 (t1 is unimportant in this case as it is unused here). The attached screenshot shows the perf report annotated assembly code from clang and gcc (clang is on the left). Gcc generated code takes 0.512 sec vs clang’s 0.731 sec. The machine I am running is a Broadwell… Intel(R) Xeon(R) CPU E5-2640 v4 @ 2.40GHz.
The code generated by gcc runs consistently faster for all values for step I tried; in some cases, the performance difference is worse than 40% seen with the aforementioned parameter values to foo. The code generated by clang is a direct result of simplifycfg that eliminates the inner branches and replaces them with select which is then lowered to the two cmov instructions.
The code generated by clang takes far fewer branches but executes more instructions. perf reports 32.76% front-end cycles idle with the clang code compared to 24.20% for gcc generated code. Clang generated code seems to perform worse in branch-miss and icache events (as reported by perf). But it is not clear why. Are the two back-to-back cmove instructions the reason? Any comments on this?